
Performance Marketing Metrics That Actually Matter
Stay updated with us
Sign up for our newsletter
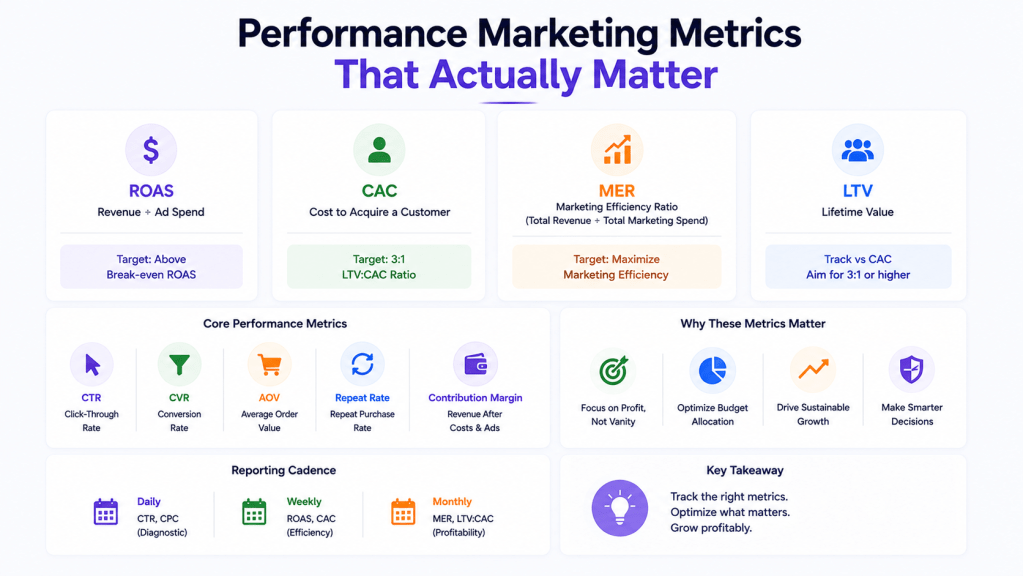
If you have been running ads for more than a few months, you already know the feeling. You open your dashboard, you see fifteen different numbers, and half of them don’t tell you anything real about whether your money is working. That is the whole problem with performance marketing metrics today. There are too many vanity numbers floating around and not enough people asking which ones actually move the business forward.
This blog is going to walk you through the performance marketing metrics that genuinely matter in 2026, why the popular ones can lie to you, and how to build a simple scorecard that tells the truth about your campaigns. We will also get into marketing KPIs, ROAS metrics, customer acquisition metrics, and advertising analytics along the way, because none of these live in isolation. They all feed into each other. By the end of this, you should be able to look at your own reporting setup and know exactly which numbers to keep, which ones to demote, and which ones to just delete from the top of the dashboard.
Why Most Performance Marketing Metrics Dashboards Are Kind of Useless?
Here’s the thing nobody tells you when you start in this field. A dashboard full of green numbers does not mean your campaign is healthy. It means someone picked metrics that were easy to make look good. Click-through rate is a classic example. It feels satisfying when it goes up, but a high click-through rate with a low conversion rate just means you got people curious, not people paying.
The reason performance marketing metrics get misused so often is that teams chase the metric that is easiest to influence instead of the one that is hardest to fake. Impressions are easy to inflate. Revenue per customer is not. If you want your reporting to mean something, you have to be honest about which numbers are cosmetic and which ones are load bearing.
A good way to think about it: every metric should answer a business question, not just a marketing question. “Did this ad get seen” is a marketing question. “Did this ad make us more money than it cost” is a business question. Performance marketing metrics that actually matter always sit closer to that second bucket.
There is also a psychological reason vanity metrics stick around longer than they should. They are easy to present in a meeting. A rising impressions graph looks like progress even when nothing about the business has actually improved. Teams get comfortable reporting numbers that go up and to the right because it feels like proof of work, even when the underlying performance marketing metrics tied to revenue are flat or declining. Breaking that habit means agreeing, as a team, on which a handful of numbers get reported every single week, and refusing to let flashy but shallow metrics sneak back onto the slide.
ROAS Metrics: The Number Everyone Watches and Almost Nobody Understands Properly
Let’s talk about ROAS metrics because this is probably the most misunderstood acronym in the entire industry. ROAS, or return on ad spend, is simply the revenue you got back divided by what you spent. Spend one dollar, get four dollars in revenue, and you have a 4:1 ROAS. Sounds simple. It is not, once you start comparing it across platforms.
In 2026, average ROAS on Google Ads sits around 3.7x, while Meta averages closer to 2.2x and TikTok trails at roughly 1.4x, according to industry benchmark data. But raw ROAS numbers between platforms are not really comparable, because attribution windows are different everywhere you look. Google Shopping can show ranges from 3x all the way to 8x depending on category and optimization.
The bigger issue with ROAS metrics is that they hide margin. A 3:1 ROAS sounds amazing until you realize your gross margin is only 25%, which means you are actually losing money on every sale. The real number to calculate is break-even ROAS, which is just 1 divided by your gross margin. If your margin is 40%, your break-even ROAS is 2.5x, and anything above that is genuine profit.
There’s also a sneaky trap called blended ROAS versus new customer ROAS. Repeat customers deliver 3 to 4 times higher ROAS than brand new customers across almost every direct-to-consumer category. That means your overall blended ROAS can look fantastic while your actual growth engine, which is new customer acquisition, is quietly struggling. If you only look at one number, this is the trap that gets you.
So what should you actually do with ROAS metrics? Track them by channel, not blended. Track new customer ROAS separately from repeat customer ROAS. And always compare your number against your own break-even math, not against some generic benchmark you found online. It also helps to track ROAS on a rolling basis instead of just monthly snapshots, since a single big sale day or a short viral moment can distort one week’s numbers and make the whole month look better or worse than the underlying trend actually is.
Marketing KPIs Beyond ROAS That Deserve a Seat at the Table
ROAS is loud, but it is not the only performance marketing metric worth your attention. There is a whole set of marketing KPIs that tell you things ROAS simply cannot.
Marketing efficiency ratio, or MER, is one of the more underrated marketing KPIs right now. It looks at total revenue divided by total marketing spend across every channel combined, instead of campaign by campaign. This matters because platforms often take credit for the same sale, and MER cuts through that noise by looking at the whole picture at once.
Another one worth tracking is contribution margin after marketing, sometimes shortened to CM2. This tells you what is actually left in the bank after product costs and ad spend, which is honestly closer to what your finance team cares about than any ad platform metric.
Then there is conversion rate by funnel stage, not just overall conversion rate. A lot of teams look at one blended conversion number and miss where the actual leak is happening. Maybe your landing page converts fine but your checkout page is where people bail. You will never catch that if your marketing KPIs stop at a single top-line percentage.
Retention rate deserves a mention here too, even though people forget it belongs on a performance marketing scorecard. Average customer retention rate across industries sits around 75.5% in 2026, and increasing retention by even 5% can boost profits by 25 to 95% depending on the business. If your marketing KPIs completely ignore what happens after the first purchase, you are missing half the story.
It is also worth adding average order value and purchase frequency to your marketing KPIs list, since both directly move your ROAS metrics without needing a single extra dollar of ad spend. A brand that increases average order value by even 10% through bundling or upsells effectively raises every campaign’s ROAS at the same cost level. Marketing KPIs are strongest when they are treated as levers you can actually pull, not just numbers you passively watch go up or down.
Customer Acquisition Metrics: Why CAC Alone Will Trick You?
Customer acquisition metrics are where a lot of performance marketers get overconfident. Everyone knows what CAC is, the cost to acquire one customer, but very few people track it the right way.
Here is the uncomfortable truth. Customer acquisition costs have jumped 60% over the past five years and a wild 222% over the past eight years across industries. Ecommerce brands specifically went from paying around 9 dollars per new customer in 2013 to nearly 29 dollars by 2022, and that number has only climbed since. Meta CPMs alone rose close to 19 to 20% year over year heading into 2026.
This is why customer acquisition metrics on their own, without context, are basically useless. A rising CAC is not automatically bad news. What matters is CAC relative to lifetime value, usually written as the LTV to CAC ratio. A healthy benchmark most teams aim for is 3:1, meaning three dollars of lifetime value for every one dollar spent acquiring the customer, with top ecommerce performers pushing closer to 8:1. Fall below 2:1 and you are basically breaking even at best, which is a warning sign that should stop any team in its tracks.
Channel mix changes your customer acquisition metrics dramatically too. Referral marketing costs somewhere between 15 and 50 dollars per customer, compared to 200 to 350 dollars for paid search in the same period. Adding even one solid referral channel can cut your overall CAC by 15 to 25% within a year. If your customer acquisition metrics only track paid channels, you are blind to the cheapest and often most loyal customers you could be getting.
One more layer worth adding to your customer acquisition metrics stack is blended CAC versus paid CAC. Paid CAC now runs about 2.4 to 3.1 times higher than blended CAC across most categories, since blended CAC folds in cheap organic and referral customers alongside expensive paid ones. If your team reports blended CAC to leadership while your actual paid channels are bleeding money, that gap will eventually catch up with the budget.
It also helps to segment customer acquisition metrics by cohort instead of looking at one big rolling average. A cohort acquired during a big discount push will behave completely differently in terms of repeat purchase rate and lifetime value compared to a cohort acquired through organic search or referral. Blending all of them into a single CAC number smooths over exactly the kind of detail that would tell you which acquisition strategy is actually building a sustainable business versus which one is just buying short term revenue.
Advertising Analytics: Connecting the Dots Instead of Reading Numbers in Silos
This is where advertising analytics comes in, and honestly this is the piece most teams skip because it takes more setup work than just reading a platform dashboard. Advertising analytics is not about collecting more numbers. It is about connecting the numbers you already have so they tell one coherent story instead of five separate ones.
The biggest advertising analytics mistake is trusting platform-reported numbers at face value. Every ad platform has an incentive to take credit for a sale, which is why the same purchase can show up as a conversion on Meta, Google, and TikTok all at once. This is called attribution overlap, and it inflates every individual platform’s reported ROAS while your actual bank account tells a very different story.
Good advertising analytics practice means building a single source of truth, usually inside a spreadsheet, a data warehouse, or a server-side tracking setup, where you can see blended performance across every channel without the double counting. It also means normalizing attribution windows. A 7-day click window on Meta is not comparable to a 30-day window on Google Shopping, and stacking those numbers side by side without adjusting for that difference produces reports that look convincing but mean almost nothing.
Server-side measurement and cleaner first-party data infrastructure have become a real competitive advantage in advertising analytics this year. Companies with mature first-party data ecosystems and clean CRM setups report roughly 34% lower average customer acquisition cost compared to peers still relying on old-school third-party cookie targeting. That gap is not small, and it is only going to widen as more of the advertising ecosystem moves away from third-party tracking.
If you take one thing from this advertising analytics section, let it be this. Stop trusting any single platform’s dashboard as gospel. Build your own blended view, even if it is a simple spreadsheet at first, and use that as the real scoreboard for every performance marketing decision you make.
The Reporting Cadence That Makes These Metrics Actually Useful
Even the right performance marketing metrics fall apart if you check them at the wrong frequency. Checking ROAS daily encourages panic decisions based on noise, since a slow Tuesday does not mean the campaign is broken. Checking customer acquisition metrics only once a quarter means you catch problems months after they start costing you money.
A workable cadence looks like this. Check tier three diagnostic numbers like click-through rate and cost per click daily, just to catch obvious technical issues like a broken landing page or a disapproved ad. Check tier two efficiency numbers like channel level ROAS and CAC weekly, since that is roughly the timeframe where trends become visible without overreacting to daily noise. Check tier one profitability numbers like break-even ROAS and LTV to CAC monthly, since these move slower and matter more for big budget decisions. Matching your reporting cadence to the right tier stops teams from making expensive changes based on numbers that were never meant to be read that often.
Building Your Actual Performance Marketing Metrics Scorecard
So how do you put all this together without drowning in numbers? Here is a simple structure that works for most teams, whether you are running a small D2C brand or a bigger martech operation.
Start with three tiers. Tier one is profitability, which includes break-even ROAS, contribution margin after marketing, and blended LTV to CAC ratio. These are the numbers that tell leadership whether the whole engine is working.
Tier two is efficiency, which includes channel-level ROAS, new customer ROAS versus repeat customer ROAS, and CAC by channel. These numbers tell you where to shift the budget.
Tier three is diagnostic, which includes conversion rate by funnel stage, click-through rate, and cost per click. These help you troubleshoot when something in tier one or two looks off, but they should never be the headline metrics in a report.
The mistake most teams make is treating tier three metrics like they belong at the top of the report. Click-through rate and cost per click are useful for troubleshooting, not for deciding whether a campaign should get more budget. Performance marketing metrics that actually matter are almost always the tier one and tier two numbers, because those are the ones tied directly to real revenue and real cash in the bank.
Wrapping It Up
Performance marketing metrics are not short on options. The problem was never a lack of data, it was picking the wrong data to obsess over. ROAS metrics matter, but only when you adjust for margin and separate new customers from repeat ones. Marketing KPIs like MER and contribution margin fill in the gaps that ROAS leaves behind. Customer acquisition metrics only mean something next to lifetime value, not on their own. And advertising analytics is the glue that stops every platform from lying to you individually.
If you build your reporting around these ideas instead of whatever numbers happen to look good on a Tuesday, you will start making decisions that actually grow the business instead of decisions that just look good in a meeting.
Frequently Asked Questions
What are the most important marketing KPIs to track for a small D2C brand?
For a small direct-to-consumer brand, the marketing KPIs that matter most are break-even ROAS, blended LTV to CAC ratio, and contribution margin after marketing spend. These three give you a real read on profitability instead of surface-level engagement numbers, and together they tell you whether growth is actually sustainable rather than just loud.
What is considered a good ROAS metric in 2026?
Most industries see healthy ROAS metrics somewhere between 2:1 and 4:1, though this varies heavily by platform and vertical, with categories like beauty and automotive often clearing 6:1 or higher on certain channels (segwise.ai, 2026). The better question is always what your own break-even ROAS is, since a 4:1 ROAS can still be unprofitable on thin margins.
How do customer acquisition metrics differ between paid and organic channels?
Paid customer acquisition metrics run significantly higher than organic ones, with paid CAC now sitting around 2.4 to 3.1 times higher than blended CAC across most industries (digitalapplied.com, 2026). Organic and referral channels tend to be far cheaper but slower to scale, which is why most healthy channel mixes lean on both instead of picking one.
Why do advertising analytics numbers differ between platforms for the same campaign?
This happens mostly because of attribution overlap and different attribution windows across platforms. A sale can get counted as a conversion on multiple platforms at once, which is why advertising analytics practices recommend building one blended, cross-channel view instead of trusting any single platform’s self-reported numbers.
Write to us [wasim.a@demandmediaagency.com] to learn more about our exclusive editorial packages and programmes.