Building a Marketing Dashboard: Metrics Every CMO Should Track
Stay updated with us
Sign up for our newsletter

You are sitting with your marketing team discussing your monthly metrics. The screen has a marketing dashboard with like 47 different graphs on it and nobody actually knows what any of them mean or what to do when a number goes up or down.
It looks impressive in a meeting but it is basically useless for making decisions.
Why?
Because a good marketing dashboard is not about showing as many numbers as possible. It is about showing the right numbers, clearly, in a way that helps leaders make faster and smarter decisions. And honestly, building one that does that is harder than it sounds.
This blog is going to walk through what a proper marketing dashboard actually looks like, which marketing KPIs for CMO level decisions actually matter, and how to build something your whole team will actually use instead of ignoring.
Why Most Marketing Dashboards Do Not Actually Work
Before getting into what a good marketing metrics dashboard looks like, it is worth understanding why most of them are kind of a mess.
The biggest problem is that most dashboards are built by whoever knows how to use the analytics tools, not by the people who actually need to make decisions from the data. So you end up with a dashboard that is technically impressive but answers questions that nobody was really asking.
The second problem is that teams try to track everything. Every channel has its own metrics, every campaign has its own numbers, and the dashboard becomes a wall of data that takes 20 minutes just to scroll through. When everything is tracked, nothing is prioritised, and the whole thing stops being useful.
The third problem is that the metrics on the dashboard are not connected to actual business outcomes. Tracking website sessions is fine but what does a 10 percent increase in sessions actually mean for the business?
A great marketing dashboard fixes all three of these problems by starting with the business questions that matter most and then working backwards to figure out which numbers actually answer those questions.
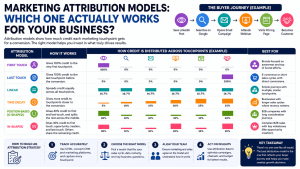
Read More – Marketing Attribution Models: Which One Actually Works for Your Business?
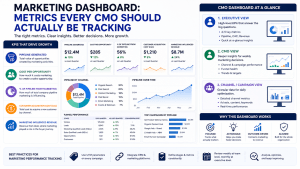
Marketing Dashboard KPIs Every CMO Should Track
If you are a CMO or leading a marketing team, these are the marketing KPIs that should be on your radar every single week.
Marketing Dashboard KPI: Pipeline Generated by Marketing
This is probably the single most important number on any B2B marketing dashboard. Pipeline generated by marketing tells you the total value of sales opportunities that marketing activities created.
If marketing is generating a strong pipeline, everything else is probably going okay. If a pipeline is dropping, something is broken and you need to figure out what fast.
Cost Per Opportunity
This one tells you how much it is costing marketing to create each sales opportunity. It is different from cost per lead because not every lead becomes an opportunity. Tracking cost per opportunity forces you to look at lead quality, not just lead quantity.
A campaign that generates 500 leads at 10 dollars each might look amazing. But if only five of those leads ever become a real sales conversation, your actual cost per opportunity is 1000 dollars. Compare that to a campaign that generated 20 leads at 50 dollars each but all 20 became opportunities.
The second campaign is clearly better even though it generated fewer leads.
Marketing’s Percentage of Revenue Pipeline
This metric shows what percentage of your total company pipeline came from marketing activities. For most B2B companies, marketing should be responsible for generating between 40 and 70 percent of pipeline. This number tells the CMO how much the sales team is depending on marketing to fill the funnel versus generating their own pipeline through outbound.
Customer Acquisition Cost by Channel
This is the total cost to acquire a new customer broken down by the channel they came from. So you would have a CAC for paid search, a CAC for content marketing, a CAC for events, and so on. This is one of the most powerful numbers in your marketing metrics dashboard because it tells you where to put more money and where to pull back.
Blended CAC (Customer Acquisition Cost)
While tracking CAC by channel is vital for optimization, Blended CAC gives you the truth of your overall business health. Blended CAC is calculated by taking your total marketing and sales spend across all channels like meta ad spends, email and whatsapp marketing, organic content and the customers acquired from that, customers acquired via ATL activities etc and dividing it by the total number of new customers acquired in that same period.
This metric is essential for CMOs because it accounts for the “halo effect”those instances where a customer sees an expensive brand awareness ad on one channel but is able to convert through a low cost organic search. If you only look at individual channel CAC, you might mistakenly cut brand spend that is actually fueling your cheaper channels. Blended CAC ensures that your total investment remains sustainable relative to your customer lifetime value.
Marketing Influenced Revenue
This is different from marketing generated revenue. Influenced revenue includes deals where marketing played a role at some point in the buying journey, even if it was not the direct source of the lead. This number is usually much bigger than generated revenue and it captures a more complete picture of what marketing is actually doing for the business.
Read More – Turning Market Signals into Revenue Opportunities with AI
Building Your Marketing Metrics Dashboard Layer by Layer
Okay so now that you know which metrics matter, here is how to actually build the marketing dashboard in a way that people will use.
Think of it in three layers.
The Executive View
The first layer is the executive view. This is what the CEO, CFO, and board care about. It should have four or five numbers max. Pipeline generated this quarter versus last quarter, marketing’s percentage of total pipeline, cost per acquisition trend, and revenue influenced by marketing. That is it. Keep it simple. When a senior leader opens the dashboard, they should be able to understand the story in 30 seconds.
The CMO View
The second layer is the CMO view. This is your weekly working view. It includes everything in the executive layer plus channel-level breakdown of pipeline and cost, campaign performance against targets, and the health of the lead funnel from top to bottom. This is what you use in your weekly marketing reviews to figure out what is working and what needs attention.
The Channel and Campaign Level View
The third layer is the channel and campaign level view. This is what your individual marketing managers look at every day. It includes the detailed metrics for whatever they are responsible for, whether that is paid ads, email, content, events, or whatever else. These numbers feed into the layers above but they are too granular to be useful at an executive level.
Building these three layers separately means everyone gets the information that is actually relevant to their role instead of everyone drowning in the same massive spreadsheet of every possible number.
Marketing Dashboard Tracking: How to Set It Up Correctly
Having a great dashboard design means nothing if the data feeding into it is wrong or missing. Marketing performance tracking is about making sure your systems are set up to capture the right information in the first place.
A few things that are really important to get right here.
UTM parameters on everything. Every link from every campaign should have UTM tags so your analytics tools know where traffic is coming from. This sounds basic but it is shocking how many teams skip this and then cannot figure out why their attribution data is all over the place.
CRM integration with your marketing platform. Your marketing automation tool and your CRM need to be synced so you can follow a contact all the way from their first marketing touchpoint through to when they become a customer. Without this connection, you cannot calculate pipeline generated by marketing or cost per opportunity because you are missing the revenue side of the equation.
Consistent reporting periods and definitions. Make sure everyone on the team is using the same definition for things like “lead” and “opportunity” and “marketing qualified lead.” And make sure everyone is looking at the same time periods when comparing numbers. It sounds obvious but teams waste enormous amounts of time arguing about numbers that are actually fine, they are just being measured differently by different people.
Regular review cadences. A dashboard that nobody looks at is just decoration. Build a habit of reviewing your CMO dashboard metrics weekly at the team level and monthly at the executive level. The review is where the value actually comes from, not the dashboard itself.
FAQ: Marketing Dashboard and CMO Dashboard Metrics
What are the most important marketing KPIs for a CMO to track weekly?
The most important marketing KPIs for CMO weekly tracking are pipeline generated by marketing, cost per opportunity by channel, marketing’s percentage of total pipeline, and lead-to-opportunity conversion rate. These four numbers together give a clear enough picture to spot problems early and make budget decisions confidently without needing to dig through 50 different metrics every week.
What should a marketing dashboard metrics include for a B2B company?
A B2B marketing metrics dashboard should always include pipeline metrics first and foremost, because pipeline is what connects marketing to revenue. Beyond that, it should show channel performance versus cost, conversion rates at each stage of the funnel, and trend lines that show whether things are improving or declining over time. Avoid cluttering it with vanity metrics like impressions or follower counts unless your specific goal is brand awareness measurement.
How is marketing performance tracking different from just checking campaign stats?
Checking campaign stats tells you how individual campaigns are doing in isolation. Marketing performance tracking is about connecting those campaign results to actual business outcomes like pipeline, revenue, and customer growth. Performance tracking looks at the whole system, not just individual parts. It answers questions like “is marketing as a function contributing to revenue growth” rather than just “did this specific ad get clicks.”
How often should CMO dashboard metrics be reviewed and updated?
The data feeding into your marketing dashboard should update automatically and in real time if possible. But the actual review cadence depends on the layer. Executive-level metrics are best reviewed monthly or quarterly. CMO-level metrics should be reviewed weekly. Channel and campaign level metrics can be reviewed daily by the people responsible for them. More frequent reviews at the executive level tend to lead to overreacting to short-term fluctuations that do not actually mean anything.